# Configure Metrics
Pomerium Enterprise uses Prometheus as a metrics collection back-end. You can configure Pomerium and the Console to talk to an existing Prometheus server, or configure the embedded Prometheus backend.
TIP
For production deployments, we suggest using a dedicated Prometheus instance.
# Prepare Pomerium
In the Pomerium
config.yaml, define themetrics_addresskey to a network interface and/or port. For example:metrics_address: 0.0.0.0:9999Copied!The example above has Pomerium providing metrics at port
9999on all network interfaces.
# External Prometheus
Add the listener to your Prometheus configuration, usually via
prometheus.yml:- job_name: 'Pomerium' scrape_interval: 30s scrape_timeout: 5s static_configs: - targets: ['192.0.2.10:9999']Copied!Reload (opens new window) the Prometheus configuration:
curl -i -XPOST path.to.prometheus:port/-/reloadCopied!In the Pomerium Enterprise
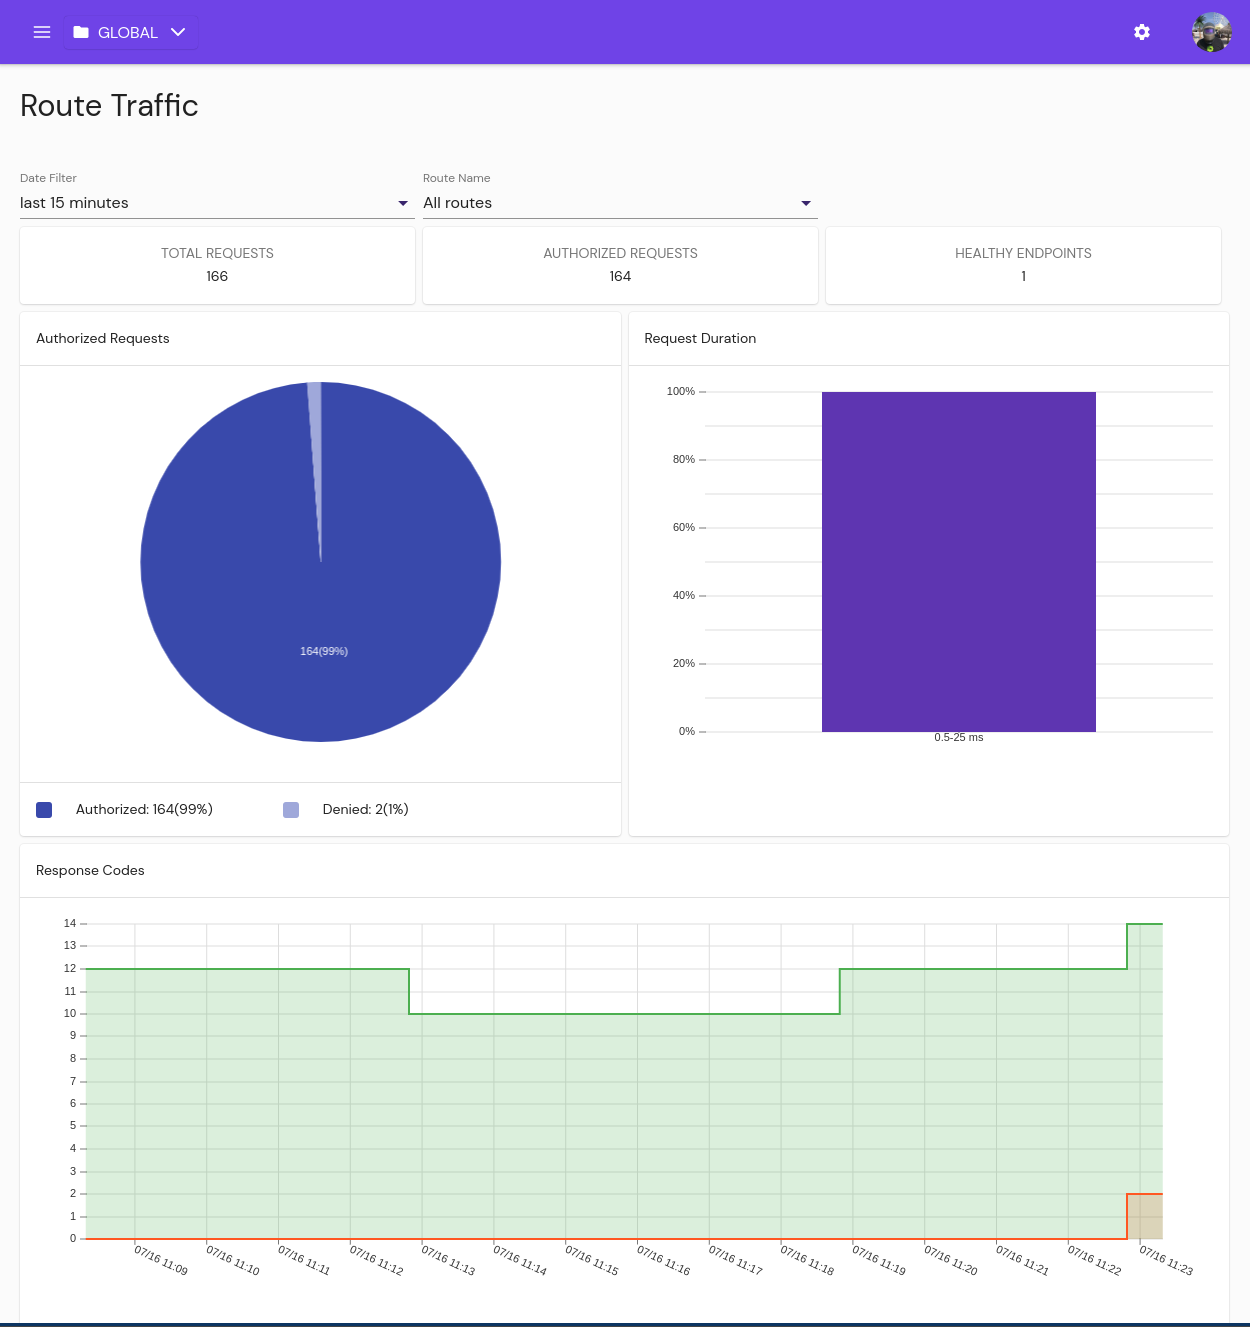
config.yamlfile, define theprometheus_urlkey to point to your Prometheus instance(s):prometheus_url: http://192.168.122.50:9090Copied!Restart the Pomerium and Pomerium Enterprise services. You should now see route traffic data in the Enterprise Console:
# Embedded Prometheus
To take advantage of Prometheus embedded in Pomerium Enterprise, edit /etc/pomerium-console/config.yaml:
prometheus_data_dir: /var/lib/pomerium-console/tsdbCopied!
The directory path can be any location that the pomerium system user can write to. The example above uses the default location created by the OS packages.